The Sources tab provides the ‘IDE’ experience. It provides a wide variety of features ranging such as live editing of code via workspaces, debugging and snippets.
Some tips and tricks follow:
1. Pretty print
Want to prettify that minified JS or CSS? The format button works ‘pretty’ well (pun intended).

2. Snippets
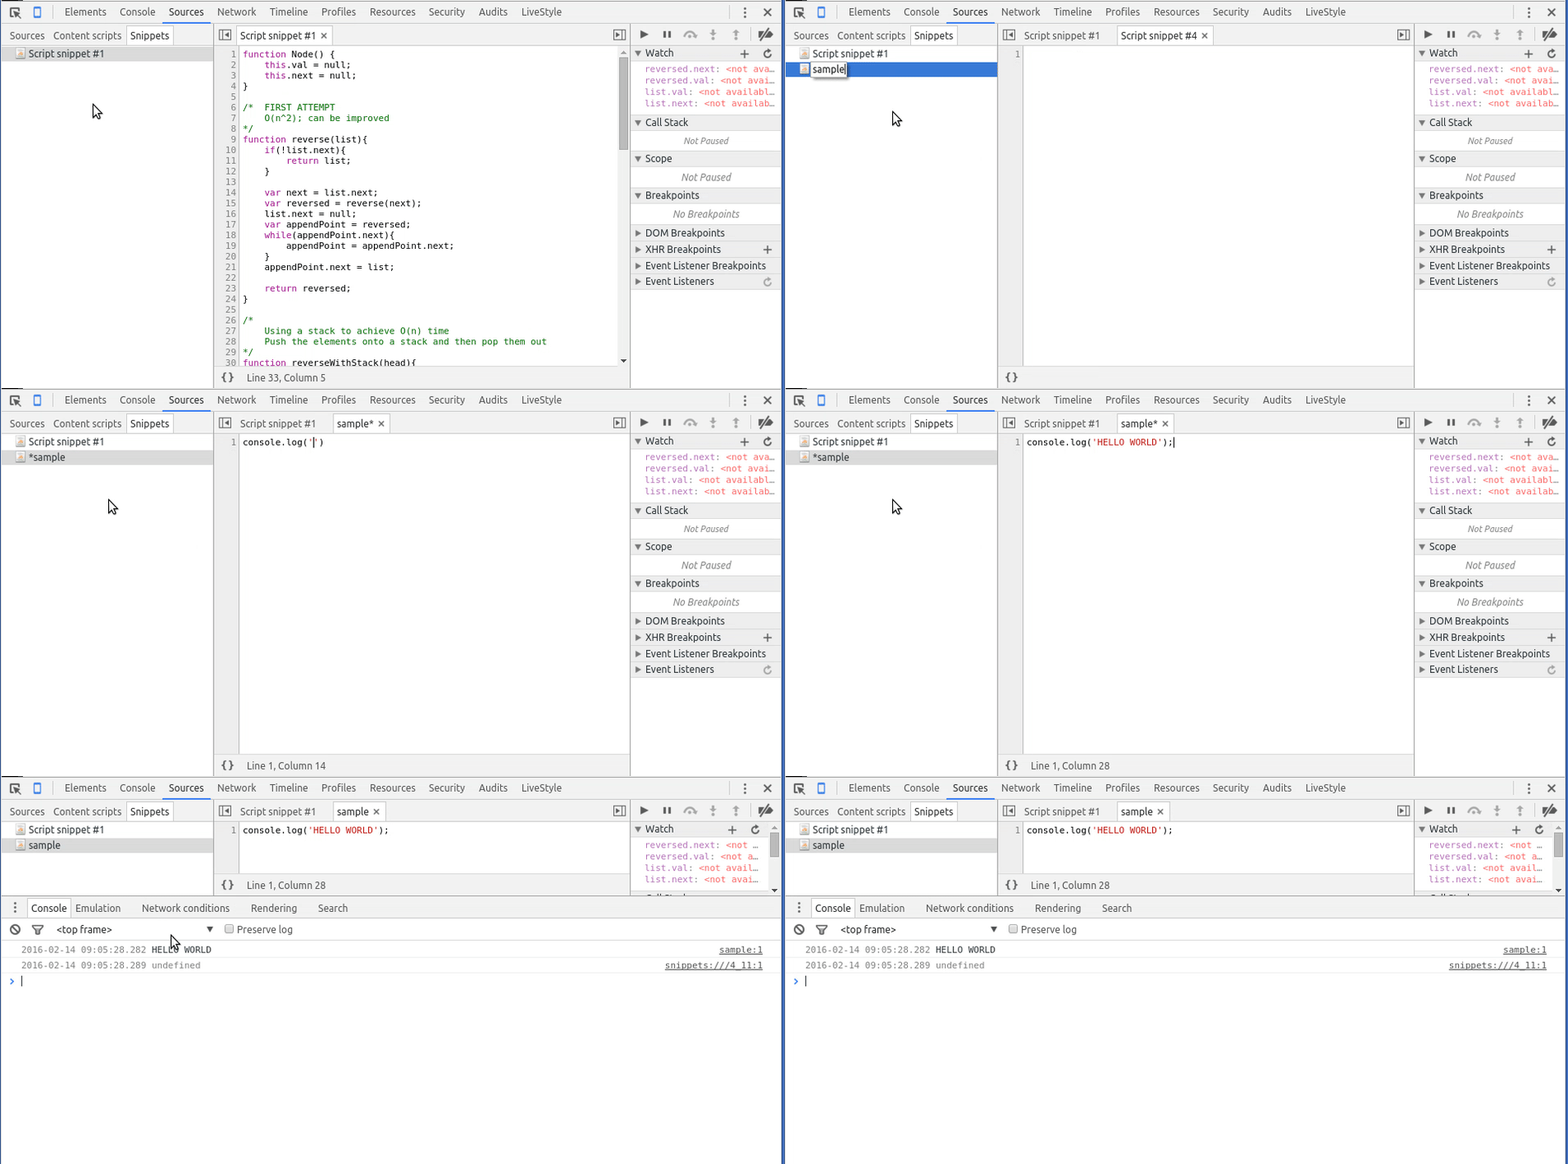
Although it is easy to just type away quick implementations in the console tab, the console has poor editing capabilities. A typo or single change necessitates editing the entire typed code.
Another approach involves creating a scratch file and copy-pasting changes to the console for execution. It works better than console editing but still requires some work.
The snippets tab offers the best solution. You edit, save and run code from one spot. Even better still, there is a curated collection of useful snippets; why not stand on the shoulders of giants?

3. Shortcuts
These are a couple of shortcuts to make debugging much more fun.
- CTRL + D: Finds the next occurrence of the selected text in that window. Useful during search as an alternative to CTRL + F. Also useful for multi-editing all occurrences simultaneously.
- CTRL + M: Useful for jumping between matching function braces.
- CTRL + O: Opens up a file drawer that you can search for specific files using a ‘sublime-like’ fuzzy matching interface. CTRL + P also works.
- CTRL + SHIFT + O: Opens up a drawer for all the functions in the open file. Useful for jumping between function definitions in a file. CTRL + SHIFT + P also works.
- CTRL + SHIFT + F: Searches across all files. Exposes regex + case sensitivity options too.
- CTRL + F: Searches current file
- CTRL + G: Jump to line number
4. Conditional Breakpoints
Setting a breakpoint is straightforward but what if you only want execution to stop when certain conditions are met? Easy-peasy, right-click on the breakpoint and write an expression. Whenever the expression is truthy; the breakpoint will be activated.
The chrome engine evaluates the expression to determine whether to break or not. What happens if there is a falsy expression that changes the live code?
There! That’s a trick for modifying the live production code during debugging – you can overwrite variables, change functions or even throw Exceptions. Just make sure your expression is falsy (or truthy if you want to break at that point). Want to turn declarations into expressions? Read about the IIFE.

5. Function definition
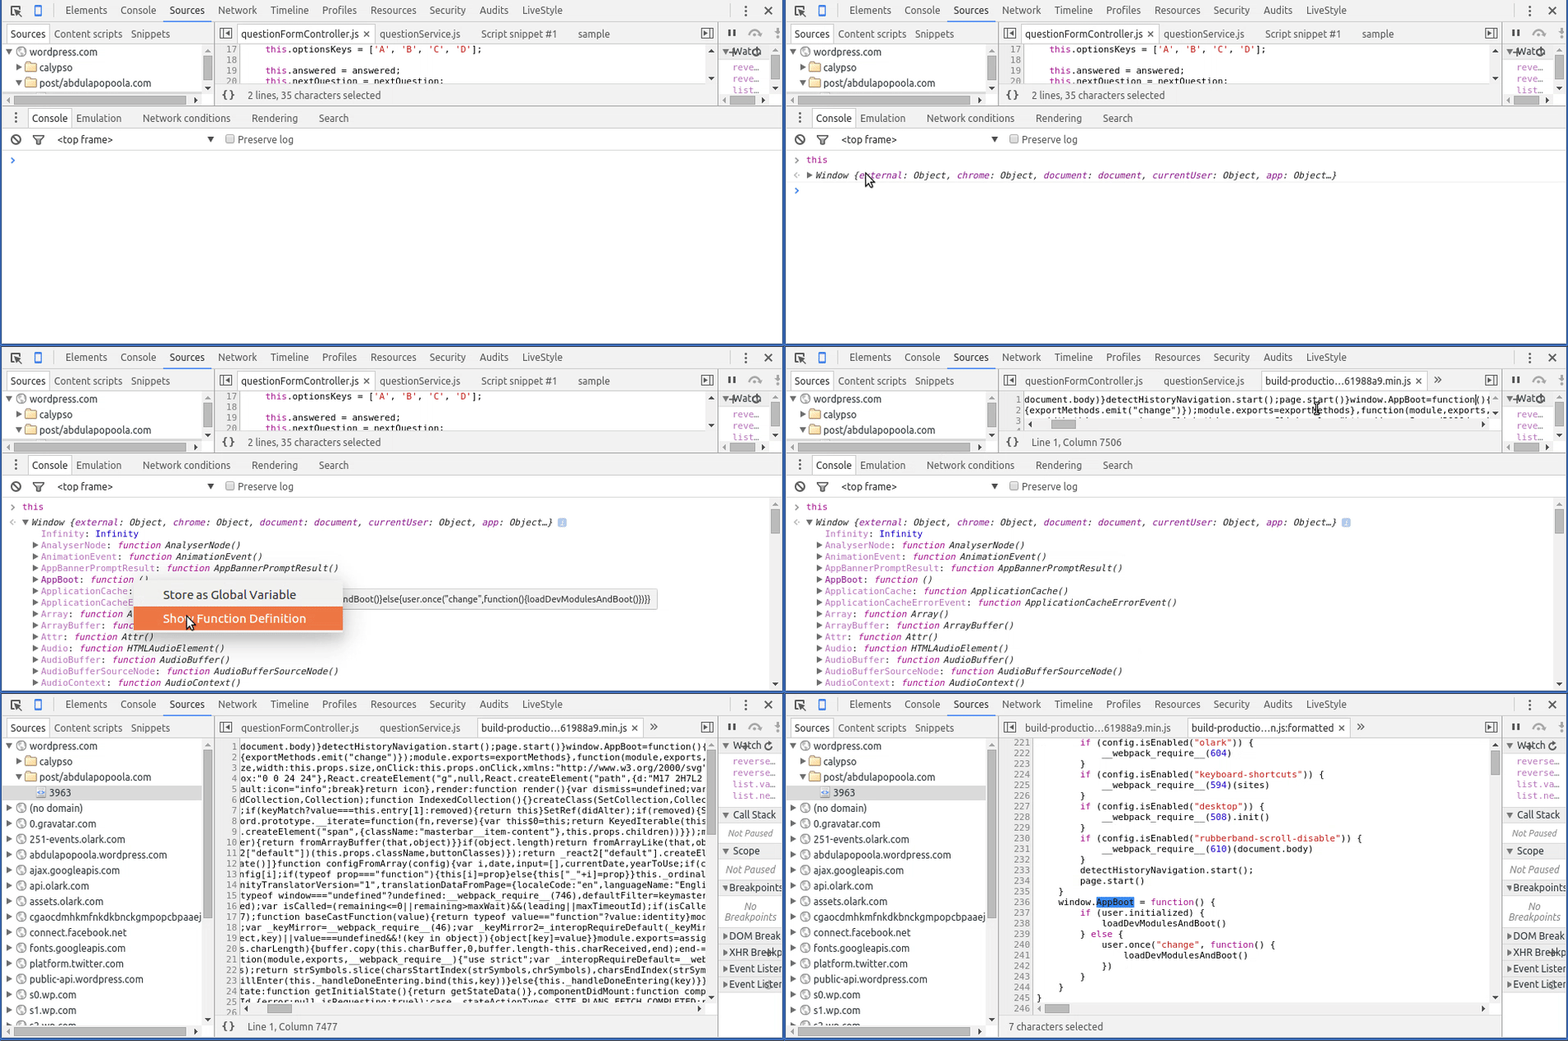
Do you know you can jump to a function’s definition directly? Before discovering this feature, I used to use invoke toString as a poor substitute for reflection or do a global find.
Chrome has a good solution to this, right-click on the function and jump to its declaration – very useful when navigating around in big huge code bases. It also works for functions that appear in the stack window.

6. XHR Breakpoints
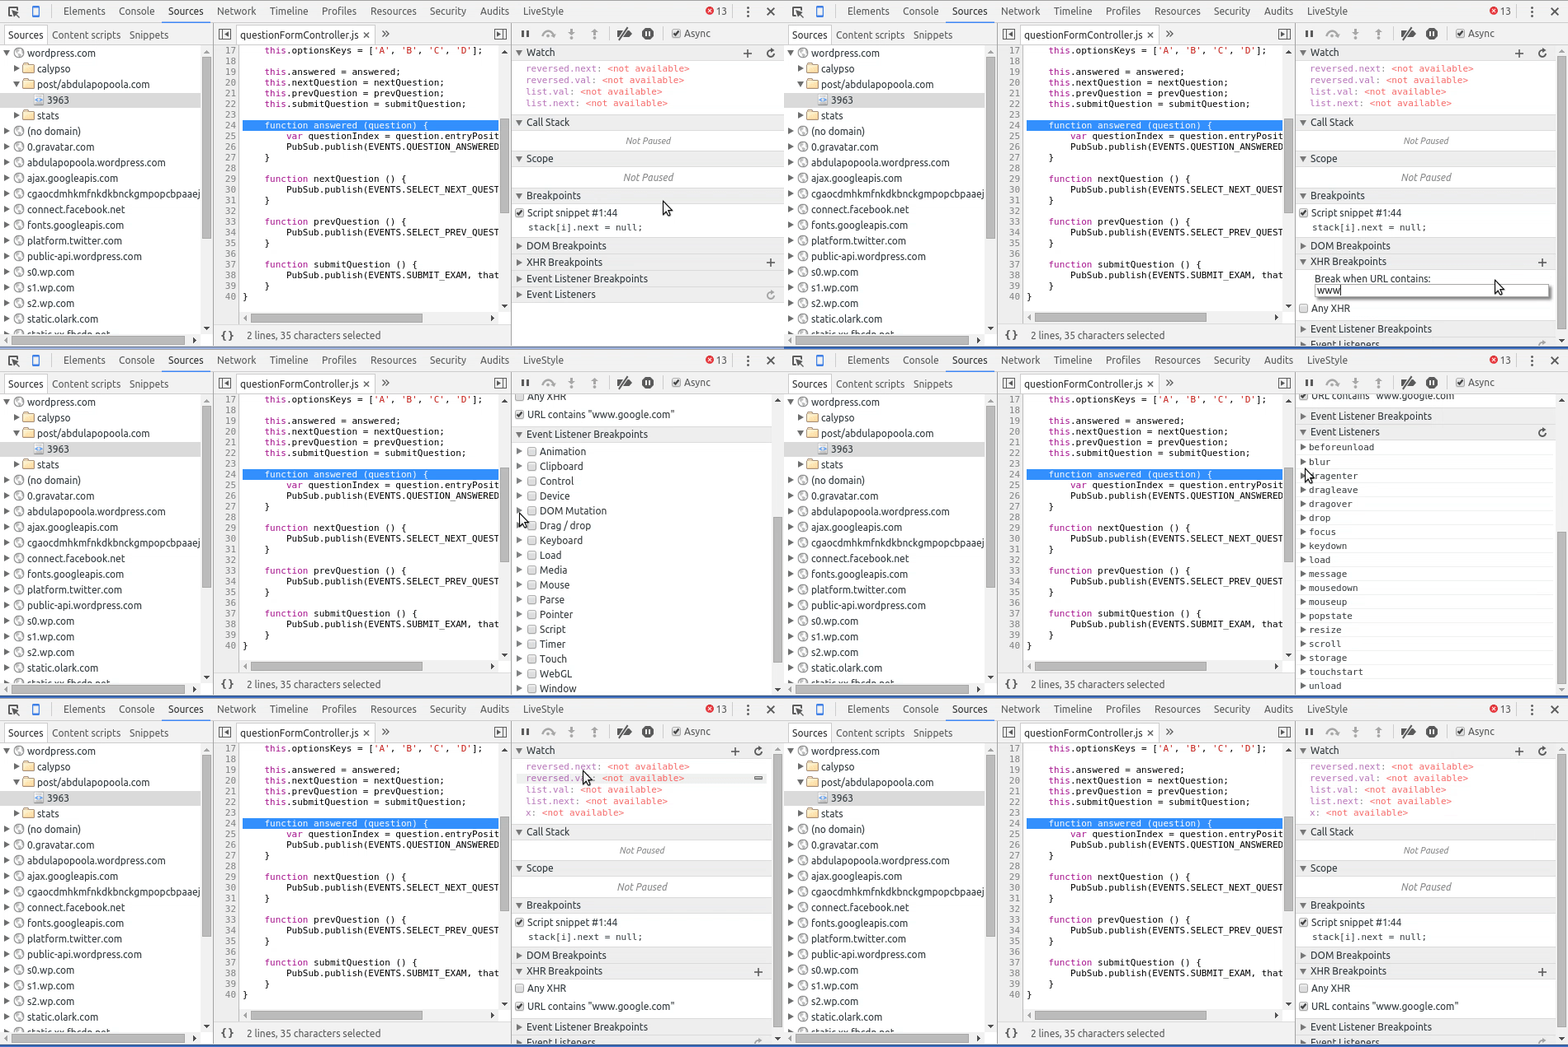
This class of breakpoints allow you to set specific breakpoints based on the endpoint URL which is very useful when debugging code involving endpoints.
Also remember to check the Async option so the call stack includes asynchronous operations e.g. AJAX calls, timeouts.

7. Exceptions
You know there is a bug somewhere but can’t find it. The ‘Pause on exceptions” option is very useful for exactly such scenarios.
Checking the “Pause on caught exceptions” checkbox means that even properly handled exceptions will still trigger a debugger stop. This has been very helpful for tracking down hard-to-find bugs.

8. Blackboxing
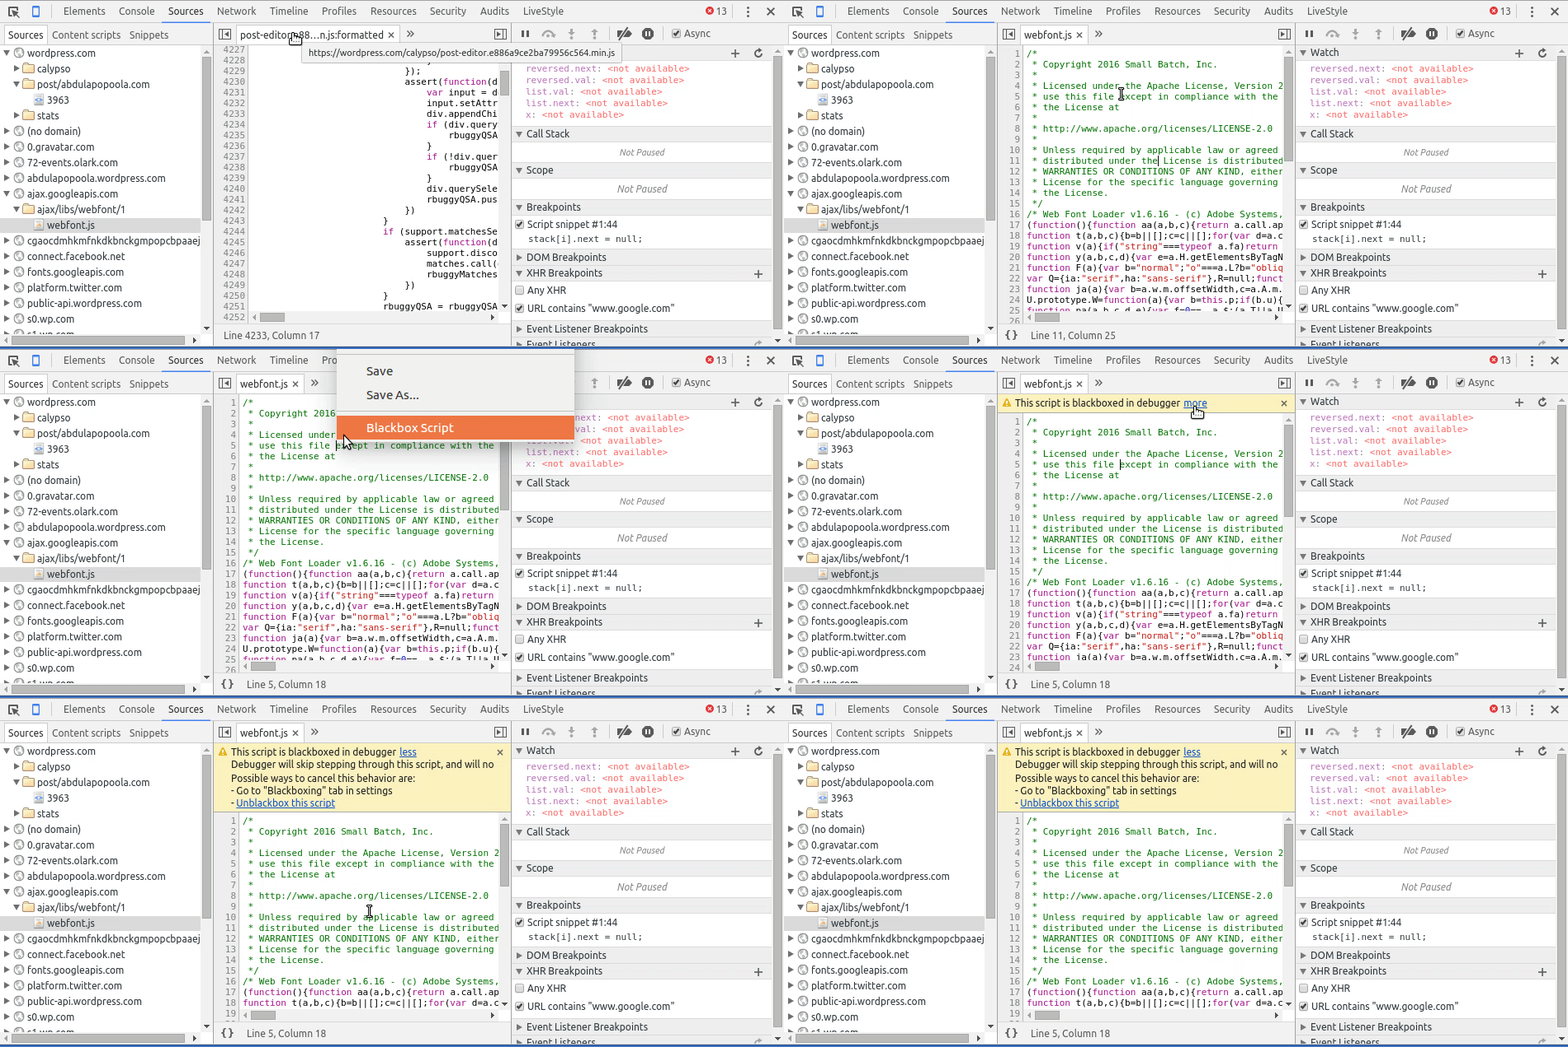
Black boxed code will be ignored and hidden during debugging. Stepping into functions defined in blackboxed scripts is a no-op. This saves you time from walking into the pits of external library call stacks.
I nearly always blackbox external libraries (e.g. jQuery, AngularJS etc). Otherwise, the debuggger is activated for exceptions thrown in external code. And as we all know, if there is a bug, it is most likely from our code.
tldr: use the blackbox to hide external scripts.

Enjoyed this? Here are some more posts in this series:
- Chrome dev tools deep dive : Elements
- Chrome dev tools deep dive : Console
- Chrome dev tools deep dive : Network
Discover more from CodeKraft
Subscribe to get the latest posts sent to your email.
The video under Conditional Breakpoints appears to be the same as the XHR video, so in Conditional Breakpoints section I cannot see the “trick for modifying the live production code during debugging”.
LikeLike
Hi Brad,
The trick for modifying production code during debugging is to change the execution context in the conditional breakpoint. You put in the JavaScript expressions that you want executed and they will get evaluated
LikeLike
Thanks for the suggestion!
LikeLike